Usage
Try live Demo
Explore live OD-Metrics examples on Binder ![]() or Google Colab
or Google Colab
Simple example.
Consider a scenario with two images, Image 1 and Image 2, and the following annotations and predictions.
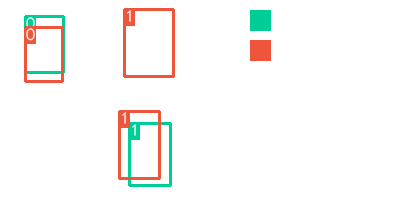 Image 1 contains:
2ground-truth bounding boxes, one for class0and one for class1;3predicted bounding boxes withlabels[0, 1, 1]andscores[.88, .70, .80].
 Image 2 contains:
2ground-truth bounding boxes, both for class0;3predicted bounding boxes, withlabels[0, 1, 0]andscores[.71, .54, .74].# Image 2 y_true = { "boxes": [[123, 11, 43, 55], [38, 132, 59, 45]], "labels": [0, 0] } y_pred = { "boxes": [[64, 111, 64, 58], [26, 140, 60, 47], [19, 18, 43, 35]], "labels": [0, 1, 0], "scores": [.71, .54, .74] }
The mAP (Mean Average Precision) and mAR (Mean Average Recall)
for this scenario are computed using OD-Metrics as follows.
from od_metrics import ODMetrics

# Ground truths
y_true = [
    { # image 1
     "boxes": [[25, 16, 38, 56], [129, 123, 41, 62]],
     "labels": [0, 1]
     },
    { # image 2
     "boxes": [[123, 11, 43, 55], [38, 132, 59, 45]],
     "labels": [0, 0]
     }
    ]

# Predictions
y_pred = [
    { # image 1
     "boxes": [[25, 27, 37, 54], [119, 111, 40, 67], [124, 9, 49, 67]],
     "labels": [0, 1, 1],
     "scores": [.88, .70, .80]
     },
    { # image 2
     "boxes": [[64, 111, 64, 58], [26, 140, 60, 47], [19, 18, 43, 35]],
     "labels": [0, 1, 0],
     "scores": [.71, .54, .74]
     }
    ]

metrics = ODMetrics()
output = metrics.compute(y_true, y_pred)
print(output)
"""
{
    "mAP@[.5 | all | 100]": 0.16831683168316827,
    "mAP@[.5:.95 | all | 100]": 0.06732673267326732,
    "mAP@[.5:.95 | large | 100]": -1.0,
    "mAP@[.5:.95 | medium | 100]": 0.06732673267326732,
    "mAP@[.5:.95 | small | 100]": -1.0,
    "mAP@[.75 | all | 100]": 0.0,
    "mAR@[.5 | all | 100]": 0.16666666666666666,
    "mAR@[.5:.95 | all | 100]": 0.06666666666666667,
    "mAR@[.5:.95 | all | 10]": 0.06666666666666667,
    "mAR@[.5:.95 | all | 1]": 0.06666666666666667,
    "mAR@[.5:.95 | large | 100]": -1.0,
    "mAR@[.5:.95 | medium | 100]": 0.06666666666666667,
    "mAR@[.5:.95 | small | 100]": -1.0,
    "mAR@[.75 | all | 100]": 0.0,
    "class_metrics": {
        "0": {
            "AP@[.5 | all | 100]": 0.33663366336633654,
            "AP@[.5:.95 | all | 100]": 0.13465346534653463,
            "AP@[.5:.95 | large | 100]": -1.0,
            "AP@[.5:.95 | medium | 100]": 0.13465346534653463,
            "AP@[.5:.95 | small | 100]": -1.0,
            "AP@[.75 | all | 100]": 0.0,
            "AR@[.5 | all | 100]": 0.3333333333333333,
            "AR@[.5:.95 | all | 100]": 0.13333333333333333,
            "AR@[.5:.95 | all | 10]": 0.13333333333333333,
            "AR@[.5:.95 | all | 1]": 0.13333333333333333,
            "AR@[.5:.95 | large | 100]": -1.0,
            "AR@[.5:.95 | medium | 100]": 0.13333333333333333,
            "AR@[.5:.95 | small | 100]": -1.0,
            "AR@[.75 | all | 100]": 0.0
        },
        "1": {
            "AP@[.5 | all | 100]": 0.0,
            "AP@[.5:.95 | all | 100]": 0.0,
            "AP@[.5:.95 | large | 100]": -1.0,
            "AP@[.5:.95 | medium | 100]": 0.0,
            "AP@[.5:.95 | small | 100]": -1.0,
            "AP@[.75 | all | 100]": 0.0,
            "AR@[.5 | all | 100]": 0.0,
            "AR@[.5:.95 | all | 100]": 0.0,
            "AR@[.5:.95 | all | 10]": 0.0,
            "AR@[.5:.95 | all | 1]": 0.0,
            "AR@[.5:.95 | large | 100]": -1.0,
            "AR@[.5:.95 | medium | 100]": 0.0,
            "AR@[.5:.95 | small | 100]": -1.0,
            "AR@[.75 | all | 100]": 0.0
        }
    },
    "classes": [
        0,
        1
    ],
    "n_images": 2
}
"""
Custom settings
By default, OD-Metrics follows MS-COCO 1 settings, including iou_thresholds, recall_thresholds, max_detection_thresholds, area_ranges, and class_metrics (see ODMetrics.__init__() method).
Custom settings can replace the default configuration. For instance, to set an IoU threshold of 0.4 and a maximum detection
threshold of 2:
from od_metrics import ODMetrics

# Ground truths
y_true = [
    { # image 1
     "boxes": [[25, 16, 38, 56], [129, 123, 41, 62]],
     "labels": [0, 1]
     },
    { # image 2
     "boxes": [[123, 11, 43, 55], [38, 132, 59, 45]],
     "labels": [0, 0]
     }
    ]

# Predictions
y_pred = [
    { # image 1
     "boxes": [[25, 27, 37, 54], [119, 111, 40, 67], [124, 9, 49, 67]],
     "labels": [0, 1, 1],
     "scores": [.88, .70, .80]
     },
    { # image 2
     "boxes": [[64, 111, 64, 58], [26, 140, 60, 47], [19, 18, 43, 35]],
     "labels": [0, 1, 0],
     "scores": [.71, .54, .74]
     }
    ]

metrics = ODMetrics(iou_thresholds=.4, max_detection_thresholds=2)
output = metrics.compute(y_true, y_pred)
print(output)
"""
{
    "mAP@[.4 | all | 2]": 0.4183168316831683,
    "mAP@[.4 | large | 2]": -1.0,
    "mAP@[.4 | medium | 2]": 0.4183168316831683,
    "mAP@[.4 | small | 2]": -1.0,
    "mAR@[.4 | all | 2]": 0.6666666666666666,
    "mAR@[.4 | large | 2]": -1.0,
    "mAR@[.4 | medium | 2]": 0.6666666666666666,
    "mAR@[.4 | small | 2]": -1.0,
    "class_metrics": {
        "0": {
            "AP@[.4 | all | 2]": 0.33663366336633654,
            "AP@[.4 | large | 2]": -1.0,
            "AP@[.4 | medium | 2]": 0.33663366336633654,
            "AP@[.4 | small | 2]": -1.0,
            "AR@[.4 | all | 2]": 0.3333333333333333,
            "AR@[.4 | large | 2]": -1.0,
            "AR@[.4 | medium | 2]": 0.3333333333333333,
            "AR@[.4 | small | 2]": -1.0
        },
        "1": {
            "AP@[.4 | all | 2]": 0.5,
            "AP@[.4 | large | 2]": -1.0,
            "AP@[.4 | medium | 2]": 0.5,
            "AP@[.4 | small | 2]": -1.0,
            "AR@[.4 | all | 2]": 1.0,
            "AR@[.4 | large | 2]": -1.0,
            "AR@[.4 | medium | 2]": 1.0,
            "AR@[.4 | small | 2]": -1.0
        }
    },
    "classes": [
        0,
        1
    ],
    "n_images": 2
}
"""
class_metrics
If True, evaluation is performed per class: detections are matched to ground truths only if they share the same label_id. If False, evaluation is category-agnostic. When True, the output includes a "class_metrics"
dictionary with per-class results. This corresponds to useCats in the COCO evaluation protocol. If not specified the default (COCO) is used and
corresponds to True.
By setting class_metrics=False, the evaluation is category-agnostic.
from od_metrics import ODMetrics

# Ground truths
y_true = [
    { # image 1
     "boxes": [[25, 16, 38, 56], [129, 123, 41, 62]],
     "labels": [0, 1]
     },
    { # image 2
     "boxes": [[123, 11, 43, 55], [38, 132, 59, 45]],
     "labels": [0, 0]
     }
    ]

# Predictions
y_pred = [
    { # image 1
     "boxes": [[25, 27, 37, 54], [119, 111, 40, 67], [124, 9, 49, 67]],
     "labels": [0, 1, 1],
     "scores": [.88, .70, .80]
     },
    { # image 2
     "boxes": [[64, 111, 64, 58], [26, 140, 60, 47], [19, 18, 43, 35]],
     "labels": [0, 1, 0],
     "scores": [.71, .54, .74]
     }
    ]

metrics = ODMetrics(class_metrics=False)
output = metrics.compute(y_true, y_pred)
print(output)
"""
{
    "mAP@[.5 | all | 100]": 0.2574257425742574,
    "mAP@[.5:.95 | all | 100]": 0.10297029702970294,
    "mAP@[.5:.95 | large | 100]": -1.0,
    "mAP@[.5:.95 | medium | 100]": 0.10297029702970294,
    "mAP@[.5:.95 | small | 100]": -1.0,
    "mAP@[.75 | all | 100]": 0.0,
    "mAR@[.5 | all | 100]": 0.25,
    "mAR@[.5:.95 | all | 100]": 0.1,
    "mAR@[.5:.95 | all | 10]": 0.1,
    "mAR@[.5:.95 | all | 1]": 0.1,
    "mAR@[.5:.95 | large | 100]": -1.0,
    "mAR@[.5:.95 | medium | 100]": 0.1,
    "mAR@[.5:.95 | small | 100]": -1.0,
    "mAR@[.75 | all | 100]": 0.0,
    "classes": [
        0,
        1
    ],
    "n_images": 2
}
"""
extended_summary
The extended_summary option in the ODMetrics.compute() method enables an extended summary with additional metrics such as IoU, AP (Average Precision), AR (Average Recall), and mean_evaluator (a Callable).
from od_metrics import ODMetrics

# Ground truths
y_true = [
    { # image 1
     "boxes": [[25, 16, 38, 56], [129, 123, 41, 62]],
     "labels": [0, 1]
     },
    { # image 2
     "boxes": [[123, 11, 43, 55], [38, 132, 59, 45]],
     "labels": [0, 0]
     }
    ]

# Predictions
y_pred = [
    { # image 1
     "boxes": [[25, 27, 37, 54], [119, 111, 40, 67], [124, 9, 49, 67]],
     "labels": [0, 1, 1],
     "scores": [.88, .70, .80]
     },
    { # image 2
     "boxes": [[64, 111, 64, 58], [26, 140, 60, 47], [19, 18, 43, 35]],
     "labels": [0, 1, 0],
     "scores": [.71, .54, .74]
     }
    ]

metrics = ODMetrics()
output = metrics.compute(y_true, y_pred, extended_summary=True)
print(list(output.keys()))
"""
['mAP@[.5 | all | 100]',,
 'mAP@[.5:.95 | all | 100]',
 'mAP@[.5:.95 | large | 100]',
 'mAP@[.5:.95 | medium | 100]',
 'mAP@[.5:.95 | small | 100]',
 'mAP@[.75 | all | 100]',
 'mAR@[.5 | all | 100]',
 'mAR@[.5:.95 | all | 100]',
 'mAR@[.5:.95 | all | 10]',
 'mAR@[.5:.95 | all | 1]',
 'mAR@[.5:.95 | large | 100]',
 'mAR@[.5:.95 | medium | 100]',
 'mAR@[.5:.95 | small | 100]',
 'mAR@[.75 | all | 100]',
 'classes',
 'n_images',
 'AP',
 'AR',
 'IoU',
 'mean_evaluator']
"""
mean_evaluator is a Callable that can calculate metrics for any combination of settings, even those not included in default compute output. For example, with standard MS-COCO 1 settings, the metric combination mAP@[.55 | medium | 10] is not included in the default compute output but can be obtained using the mean_evaluator, after calling compute.
from od_metrics import ODMetrics

# Ground truths
y_true = [
    { # image 1
     "boxes": [[25, 16, 38, 56], [129, 123, 41, 62]],
     "labels": [0, 1]
     },
    { # image 2
     "boxes": [[123, 11, 43, 55], [38, 132, 59, 45]],
     "labels": [0, 0]
     }
    ]

# Predictions
y_pred = [
    { # image 1
     "boxes": [[25, 27, 37, 54], [119, 111, 40, 67], [124, 9, 49, 67]],
     "labels": [0, 1, 1],
     "scores": [.88, .70, .80]
     },
    { # image 2
     "boxes": [[64, 111, 64, 58], [26, 140, 60, 47], [19, 18, 43, 35]],
     "labels": [0, 1, 0],
     "scores": [.71, .54, .74]
     }
    ]

metrics = ODMetrics()
output = metrics.compute(y_true, y_pred, extended_summary=True)
mean_evaluator = output["mean_evaluator"]
_metric = mean_evaluator(
    iou_threshold=.55,
    max_detection_threshold=10,
    area_range_key="medium",
    metrics="AP"
    )
print(_metric)
"""
{'mAP@[.55 | medium | 10]': 0.16831683168316827}
"""
mean_evaluator function, refer to the extended_summary option in the ODMetrics.compute() method.
IoU
The calculation of mAP and mAR relies on IoU (Intersection over Union). You can use the standalone iou function from OD-Metrics.
from od_metrics import iou

y_true = [[25, 16, 38, 56], [129, 123, 41, 62]]
y_pred = [[25, 27, 37, 54], [119, 111, 40, 67], [124, 9, 49, 67]]

result = iou(y_true, y_pred, box_format="xywh")
print(result)
"""
array([[0.67655425, 0.        ],
       [0.        , 0.46192609],
       [0.        , 0.        ]])
"""
iou function supports the iscrowd parameter from the COCOAPI. For more details, refer to the iscrowd section.
References
-
Tsung-Yi Lin, Michael Maire, Serge Belongie, James Hays, Pietro Perona, Deva Ramanan, Piotr Dollár, and C Lawrence Zitnick. Microsoft coco: common objects in context. In Computer Vision–ECCV 2014: 13th European Conference, Zurich, Switzerland, September 6-12, 2014, Proceedings, Part V 13, 740–755. Springer, 2014. ↩↩